
REDUCE PILL WASTE
SECORA was engaged by a large European Pharmaceutical Company to address a particular problem relating to its manufacturing processes. Specifically production of a well known brand of pills was at risk due to material variation in pill weight. Correct pill weight is critical to ensure correct medication.
SECORA utilized the traditional DMAIC approach in order to determine with accuracy the root causes of variation in pill weight. DMAIC is a tried and proven methodology for identifying variation in processes and was well understood and accepted by our client.
OUR APPROACH
The project “Reduce Pill Waste” was conducted using the 5 phase Six Sigma method DMAIC (Define, Measure, Analyze, Improve, Control).
Describe the business pain and the full arguments for the project. At the end of the define phase a completed project charter is to be presented to the project sponsor for approval.
Collect and test information/data. Various analytical tools are used here to collect information and to test the quality of this information. If not enough information is collected, this increases the probability of a beta error (saying nothing is wrong, when in fact there is). If the information is of poor quality, this increases the probability of an alpha error (saying there is something wrong when in fact there is not).
Make a decision. Based on the information collected in the measure phase, decisions are made here as to what is causing the business pain described in the define phase.
Fix/improve the process. Various possible solutions are analyzed and tested to confirm elimination of the business pain.
Stable and predictable process. PDCA (Plan-Do-Check-Act) process controls are placed within the process to react on leading indicators (found during the analyze phase) which have a direct impact on the business pain (lagging indicator).
DEFINE PHASE
Problem Statement, Business Case & Goal Statement
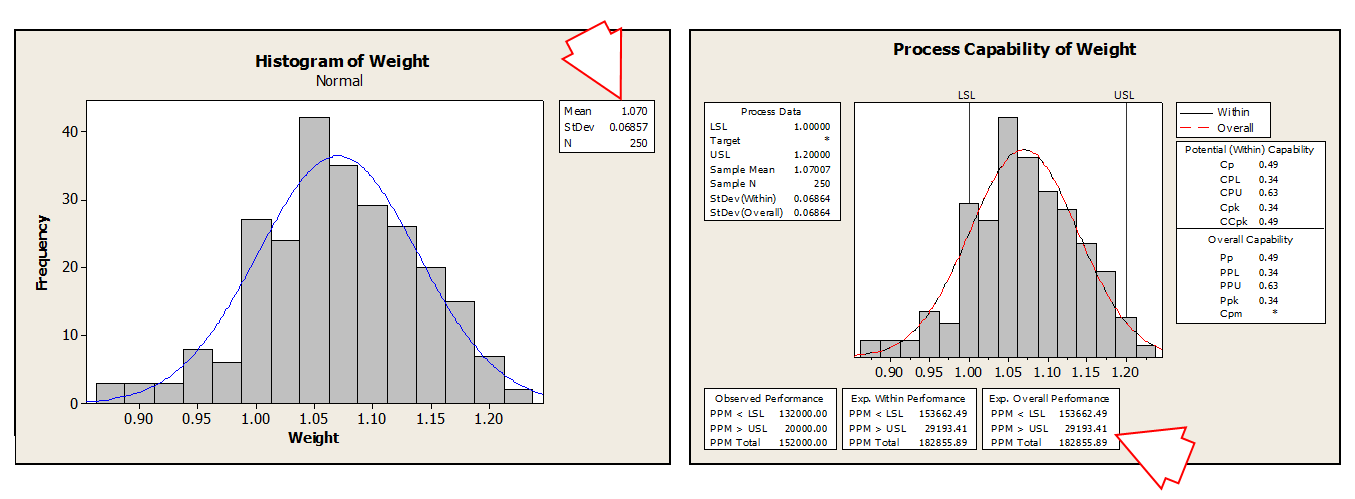
Problem Statement: The variation (designated as “Y1”) in weight and pills not conforming to weight specifications (designated as “Y2”) within (brand name confidential) is unacceptable.
MEASURE PHASE
Collect data and determine the baseline/current process performance
The client team believed a number of “causes” were responsible for the variation and non-compliance with the pill weight specifications. A data collection plan was developed and potential causes measured over 250 batches on both manufacturing lines.
Initial Findings:
- Molecular size testing – possible statistical difference between manufacturing lines in molecular standard deviation, which could have a negative effect on pill variation and weight specification non-compliance.
- Pill compression time testing – the overall range (irrelevant of manufacturing line) within the compression time was quite large (0.187 to 0.20050). This could lead to the variation and specification non-compliance within the pill weight. Once again, we see differences between manufacturing line 1 and 2 both in range, standard deviation, and average. Once again, proving that the manufacturing lines (x2) could be responsible for the variation and non-compliance with in the pill weight.
- Fill ratio – the overall range (irrelevant of manufacturing line) within the fill ratio was quite large (0.4540 to 0.5500). This could lead to the variation and specification non-compliance within the pill weight. Once again, we see differences between manufacturing line 1 and 2 both in range and standard deviation. Once again, proving that the manufacturing lines (x2) could be responsible for the variation and non-compliance with in the pill weight
- Line speed testing – possible effect on variation and non-compliance with pill weight. CAUTION: Because the line speed can only be measured in whole numbers, it would be imprudent to make a decision at this stage. We will use other process engineering tools later to confirm or disapprove this factor.
Measure phase findings compiled: Differences in individual manufacturing lines, compression times, and fill ratio could have a direct impact on the variation and non-compliance within the pill weight. Furthermore, further investigation is required as to possible “interactions” between the factors (could one factor increase or decrease the other factors influence). Finally, line speed is measured has to be analyzed in greater detail because measuring in whole numbers gives us little indication whether or not this factor has a positive or negative influence on the variation or non-compliance within the pill weight.
ANALYSE PHASE
Testing the perceived “causes” of variation
During the ANALYZE phase it is important to prove statistically that the various reasons the team believes is causing the variation and non-compliance within the pill weight. We prove or disprove, to a high probability, the inputs to the pill manufacturing process causing the variation we are attempting to reduce to a satisfactory level.
Findings:
- There is statistical proof that the manufacturing lines (1 and 2) operate differently and thus are a contributing factor to Y2 (non-compliance within pill weight). There is a 99.999% probability this factor is one of the root causes.
- We can say with high confidence that there is NO statistical proof that the manufacturing lines (1 and 2) are the cause for Y1 (variation within the pill weight). There is only a 74.40 – 79.10% probability this factor is one of the root causes.
- BOTH manufacturing lines are out of specification. Manufacturing line 1 produces @18% bad product and manufacturing line 2 @ 10% bad product.
- Molecular size does have an effect on both variation within the pill weight and non-compliance within the pill weight; BUT is only responsible for 4.3% of the total variation within the weight.
- We can say with a 99.999% confidence that line speed is also a root cause for the variation and non-compliance within the pill weight (25.40% to 26.16% of the variation).
- We can state with a 99.999% surety that compression time has a direct and linear effect on non-compliance within the pill weight (35.4% of the variation within pill weight).
- There is only a 61.7% chance that ambient moisture is responsible for the variation and non-compliance within the pill weight. Furthermore, it is responsible for less than 0.4% of the variation within the pill weight. We can comfortably ignore this factor from any further analysis.
- There is only a 81.9% chance that particle size is responsible for the variation and non-compliance within the pill weight. Furthermore, it is responsible for less than 1.4% of the variation within the pill weight. We can comfortably ignore this factor from any further analysis
- We can state with a 99.999% surety that fill ratio has a direct and quadratic effect on non-compliance within the pill weight. In addition, it also explains 33.0% of the variation within the pill weight.
As a result of this testing it was confirmed that the following factors were causes of the variation in pill weight and specification and were therefore confirmed as candidates for optimization:
- Manufacturing line
- Compression time
- Line speed
- Fill ratio
IMPROVE PHASE
Find solutions targeted at verified causes from the ANALYZE phase.
To show with data that solutions are developed which solve the problem and lead to improvement. Steps:
- Decide whether to go proceed with DMAIC or move to DFSS – does it make sense to improve the existing process or do you have to design an entirely new one?
- Identify solutions addressing important “causes” – which potential solutions are there? What criteria will you use to assess alternative solutions, and evaluate solutions?
- Minimize risks and implement solutions
Important considerations: What risk attaches to the selected solution, how to mitigate these risks? Should a pilot be run for the selected solution? What has to be planned to implement the solution? How will results be checked?
Because we were able to identify with high certainty which factors have the largest and most significant impact on variation in pill weight and specification it was decided to conduct a Design of Experiment (“DOE”) with these factors.
Findings:
- There is a direct linear correlation between compression time and pill weight
- Even though there is no direct correlation between fill ratio and pill weight, there is a squared relationship between fill ratio and pill weight
- The cause line speed has been deleted from the model
- We can explain 64.6% of the variation of the pill weight with these two factors
- The mathematical model is sound because of the high P-Value (0.887) of the lack of fit.
To optimize the output (Y1) “pill weight” and to reduce the output (Y2) “pill weight variation”, we ran the DOE model through the response optimizer for the optimal settings. To reach our goal of each pill weighing between 1.000 and 1.200 grams, we set compression time at 0.21300 and fill ratio at 0.46772. To prove this theory we ran a pilot of 30 runs at these setting in order confirm (or deny) our pilot.
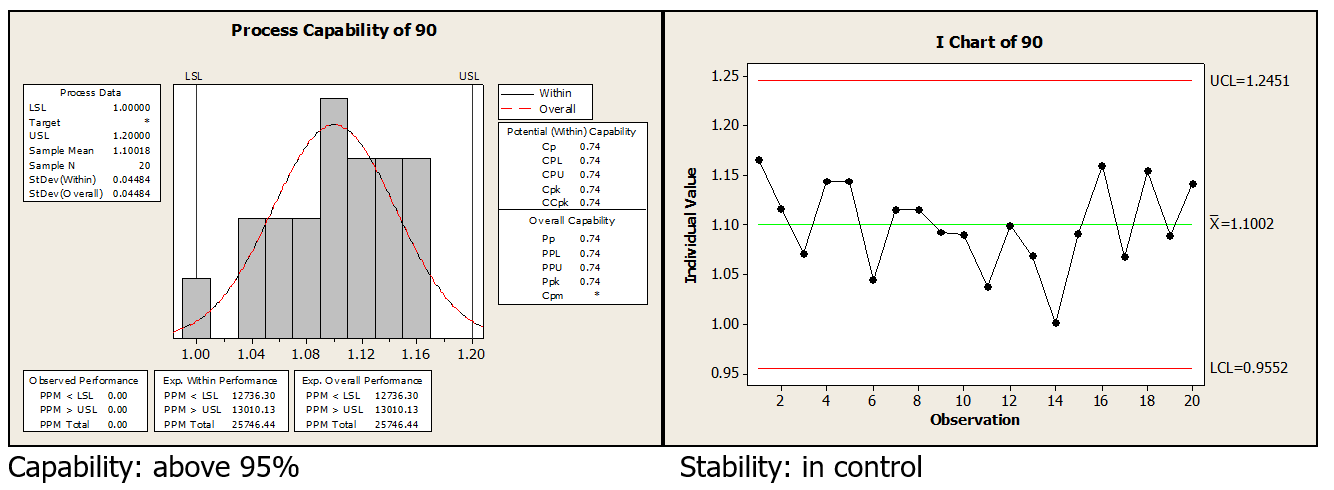
Improve phase conclusions: The pilot achieved both targets, i.e. Y1 (reduce variation from 0.0634 to 0.0500) and Y2 (Be within specification of pill weight 1.000 to 1.200). The pilot was successful.
CONTROL PHASE
to ensure sustainability of the process improvements, evaluate the accomplished results and finally close the project.
Process Management asks for establishing “leading indicators” (X) in addition to or instead of “lagging indicators” (Y) based on the analysis results. This means we are no longer ONLY monitoring the variation and non-compliance of the pill weight, but mainly the two critical factors we verified during the analyze and improve phase of the project; i.e. compression time and fill ratio.
To make sure we do not make any unnecessary changes to the process, and only make adjustments when warranted, control charts were built into the process, which allows the process owner to visually see if there is common cause variation or special cause variation, which will determine the correction plan.
Control charts and process capability are reviewed at 30, 60 and 90 days post optimization. The 90 day results where:
CONCLUSION
Project close out and follow up successful. Project CLOSED.
THE FINAL RESULTS
- 95% of pill wastage was eliminated, meaning an annual saving of 1,000,000 sFr
- Project term 21 weeks
- Commitment from team and advisors, 20 hours per week
- Project cost 175,000 sFr
“SECORA utilized the traditional DMAIC approach in order to determine with accuracy the root causes of variation in pill weight. DMAIC is a tried and proven methodology for identifying variation in processes and was well understood and accepted by our client.”
OTHER CASE STUDIES
Please note: some project details may not be available, due to confidentiality agreements with our clients.
Automotive
The project’s purpose was to reduce rail car demurrage for the client’s company. Rail cars are used to move material (parts) from suppliers to the automotive assembly plant and supporting facilities. Demurrages are tariff charges assessed for detaining freight cars beyond their specified time limit. Demurrage charges are billed to the assembly plant from the railroad when rail cars are held at the assembly plant or supporting facilities beyond the contracted amount of time.
End-to-End preparation of Tax Returns
A Kaizen (Continuous improvement) initiation project was led by SECORA from September 2007 until December 2007 at one of the ‘big 4’ accounting companies in Sydney, Australia. The project reviewed the firm’s process for the completion of international tax returns.
Laser Welding (Automotive)
A Tier 1 European automotive supplier had major issues on a newly launched product: Failure to meet customer volume requirements; Failure to meet customer quality requirements; Massive cost overrun. Using the SLIM (Lean) Methodology SECORA helped the client to solve its most prominent operational effectiveness issues and reduce internal manufacturing cost to below the original target costing, without capital investment or design change.
Logistics
SECORA was engaged by a major logistics organisation to review and optimize the business processes surrounding the management of third party contractors within its IT Department.